
💎 Crystal
science
Climate Change in One Chart — What's Warming and How Fast
Earth has warmed about 1.5°C since the late 1800s. Here's what's driving it and what different levels of warming actually mean.
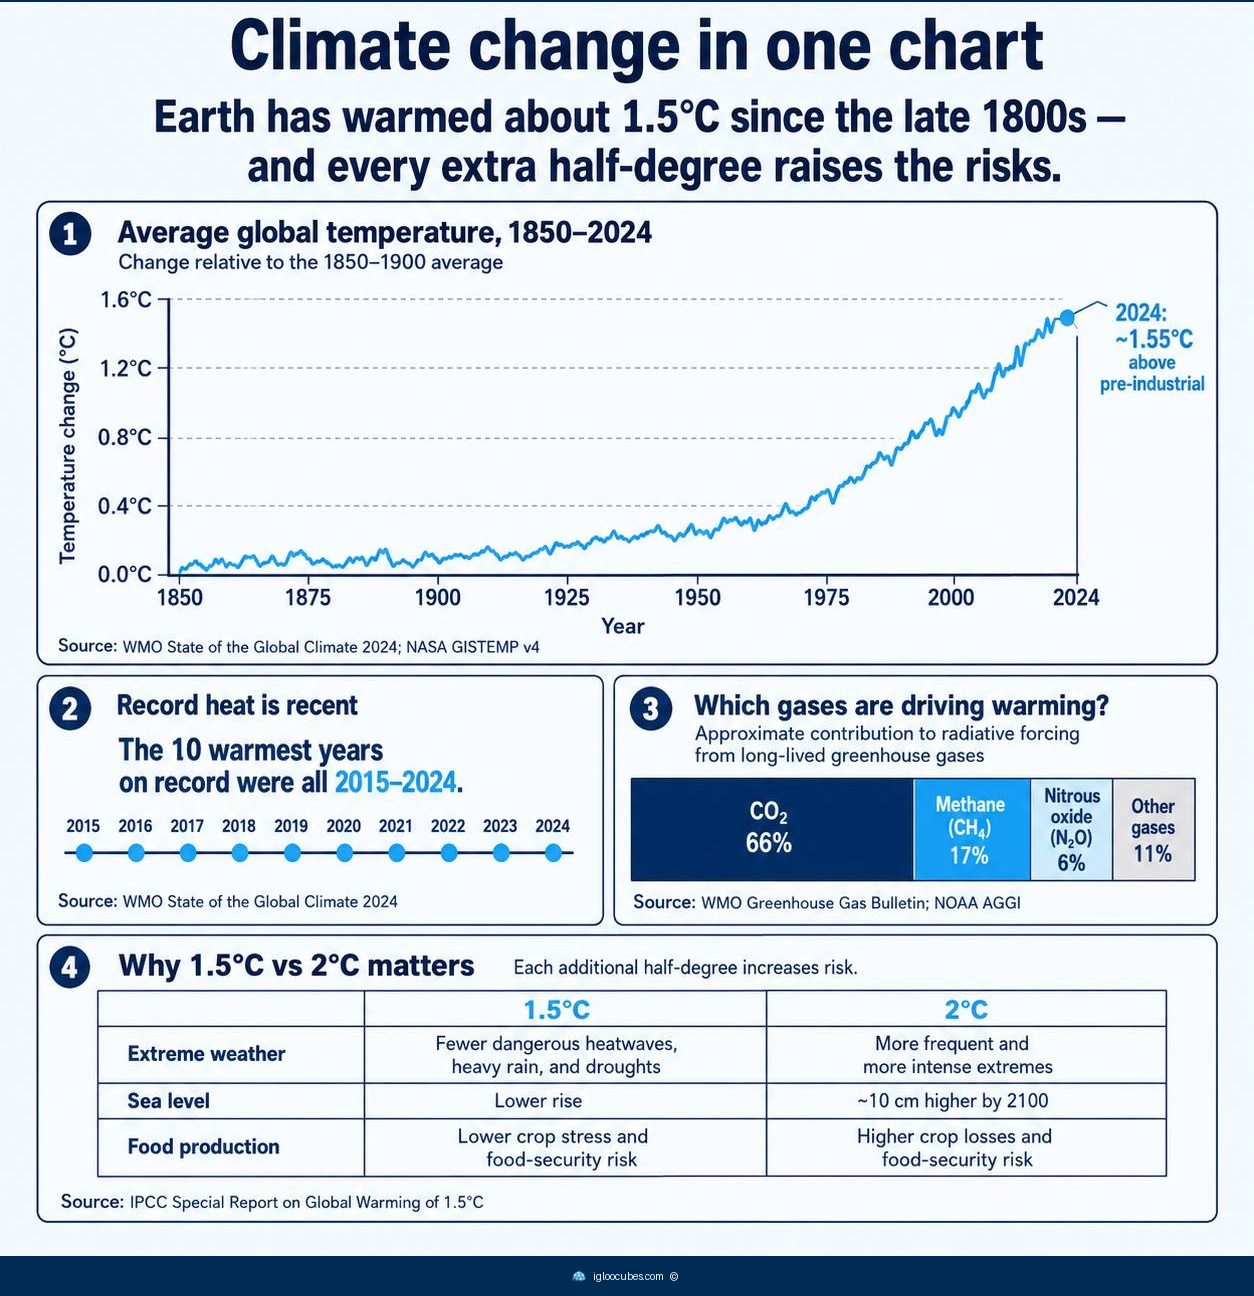
- Earth has warmed about 1.5°C since the late 1800s, with the 10 warmest years on record all occurring between 2015 and 2024.
- CO2 accounts for 66% of warming, followed by methane (17%) and nitrous oxide (6%) — agriculture and fossil fuels are the main sources.
- At 1.5°C of warming: 14% of species face extinction risk, 70-90% of coral reefs are lost, and extreme heat waves become 4x more likely than pre-industrial levels.
- At 2°C: those impacts roughly double — 18% of species at risk, 99% of coral reefs lost, and heat waves 14x more likely. Every fraction of a degree matters.
The data is straightforward even if the politics aren’t. The planet has warmed about 1.5°C since the Industrial Revolution, and the rate of warming has accelerated sharply since the 1980s.
The 10 warmest years on record all happened in the last decade — 2015 through 2024. That’s not a natural fluctuation. It’s a trend.
The main driver is the buildup of greenhouse gases from human activity. Carbon dioxide from burning fossil fuels accounts for roughly two-thirds of the total warming effect. Methane from agriculture and natural gas leaks adds another 17%. Nitrous oxide from fertilizer use and industrial processes adds 6%.
The difference between 1.5°C and 2°C of warming isn’t academic. At 1.5°C, about 14% of species face extinction risk and 70-90% of coral reefs are lost. At 2°C, extinction risk rises to 18% and 99% of coral reefs disappear. Extreme heat waves become 14 times more likely at 2°C versus 4 times more likely at 1.5°C. Every fraction of a degree of avoided warming measurably reduces the damage.